zebras - data analysis library for javascript

![]()
Zebras is a data manipulation and analysis library written in JavaScript offering the convenience of pandas or R.
Zebras is especially useful for JS data analysis and visualization projects in notebooks on ObservableHQ or using the JS Jupyter kernel.
Unlike pandas, zebras is purely functional. All zebras functions accept data as an argument and return a new data structure transformed, and 'dataframes' are simply arrays of JS objects without any special methods.
Zebras is built on top of Ramda. Think of zebras as a collection of Ramda functions, and compositions of them, curated and repackaged for common data processing and data analysis tasks.
As in Ramda, all zebras functions are curried, making them easier to chain together. This means that, for example, zebras.sortByCol(col, df) is equivalent to zebras.sortByCol(col)(df).
An interactive introduction to the zebras library - using S&P 500 data - is available as an Observable notebook.
See the project roadmap on the zebras wiki here.
A guide to using zebras in a JS Jupyter notebook can be found on the zebras wiki here.
To Install
Locally with Node / Jupyter
npm install zebras --save
const z = require("zebras")
Online in an Observable notebook
z = require("zebras")
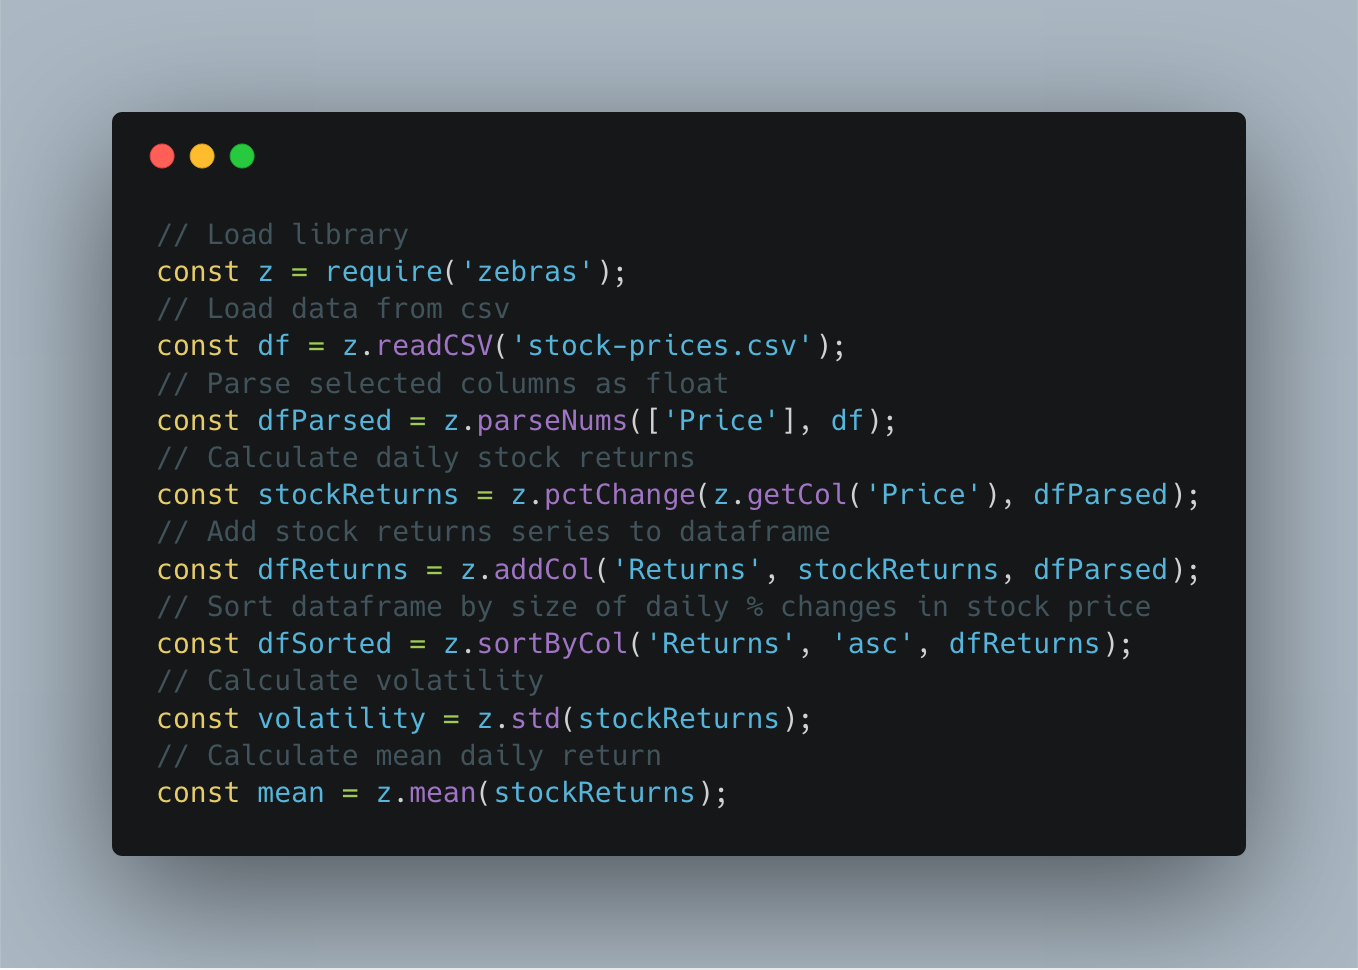
Example Usage
const z = require("zebras")
const data = z.readCSV("data.csv")
const parsedData = z.parseNums(["speed", "acc"], data)
const speed = z.getCol("speed", parsedData)
const avgSpeed = z.mean(speed)
Note: make sure numerical data imported into Zebras does not contain commas ("2342.5", not "2,342.5") - commas within numbers will throw off the parsing and lead to unexpected results.
Piping example:
const z = require("zebras")
const avgSpeed = z.pipe([
  // array of functions for input to travel through
  z.readCSV,
  z.parseNums(["speed", "acc"]),
  z.getCol("speed"),
  z.mean,
])("data.csv")